SSLS Blog Post: Noelle Lambert
My name is Noelle Lambert, and I am a rising third-year student at Georgia Tech. My majors are public policy and economics with a concentration in environmental and energy policy, so when I learned about an opportunity at the Center for Serve-Learn-Sustain, my interest was immediately piqued. Sure, I had taken classes familiarizing me with the principles of sustainability and how environmental justice influences policy, and vice versa, but potentially being involved with the tangible implementation of sustainability through technology was another thing altogether.
I wanted to focus my work on how technology impacts communities and why the technology even exists.
Sea level rise is an increasing threat every day as industries pollute more, individuals consume more, and decision makers continuously fail to take adequate action. However, given my background and passion for analyzing the practical effects that policy decisions have on marginalized populations, I wanted to focus my work on how technology impacts communities and why the technology even exists.
It quickly became clear to me that the Smart Sea Level Sensors are a highly important aspect of disaster preparedness and resilience. Savannah, Georgia is at the intersection of several pressing challenges: the issue of sea level rise exacerbated by global warming, natural disasters like hurricanes and intruding pollution from neighboring industries, shortages of quality food and affordable housing… the list goes on. I knew I could play a small, but potentially valuable role in helping with Savannah’s challenges. My supervisor, Allen Hyde, helped me better understand the issues at hand and hone in on specific work to be done.
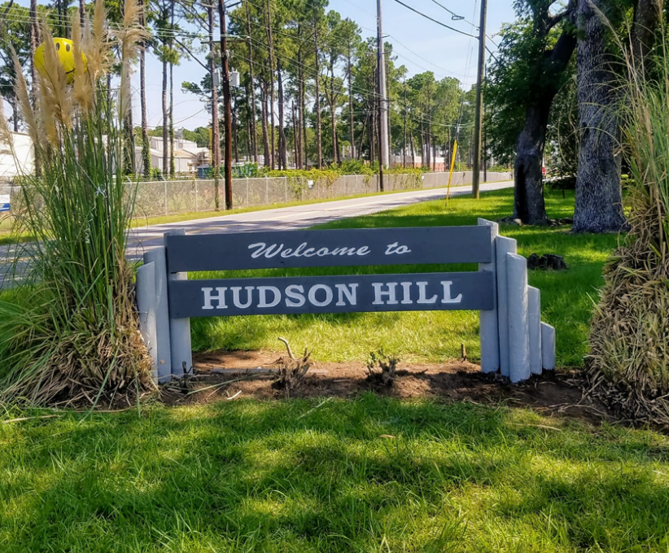
The first piece of my work was understanding the social, economic, and environmental context of the area. I have worked closely with Allen, Nick Deffley, and Meaghan McSorley on the Community Engagement team to create and provide resources for the Harambee House, the first of which was a condensed version of the Community Profile Report of the Hudson Hill Community. The document serves as an in-depth resource for local actors like government agencies and nonprofits to analyze the potential impacts of policy decisions. My job was to examine this document to create a more accessible resource for community members, as well as decision makers to contextualize the area to create impactful policy. The most important facts and narrative based information were prioritized and organized into: social, environmental, housing, transportation, and health categories.
My biggest takeaway from this task was truly understanding objectives beyond checking a box. Sure, it may have taken a few hours to skim through the entire report and pick the most seemingly notable statistics. But, if the audience is a member of the neighborhood picking up a flyer, a local member of the city council reading a policy memo citing research, or a student perusing the SSLS blogs, each word matters. Savannah lies at the center of several historical and deeply systemic problems, but it is also a beautiful community. It has experienced poverty, chemical runoff, and food deserts, but also is the home to a plethora of churches, community centers, home-owning families, and frequently used public transportation systems. Those statistics are just as important.
After the community profile, my team and I began to focus on the health assessment: identifying academic resources connecting the major pollutants emitted by industrial plants in the Hudson Hill area to negative health ailments. My research started out very broad: I simply tried to compile as many papers as I could that maximized the number of pollutants and the number of ailments. From there, I cut down my list prioritizing concise yet informative sources, organizing them by strength of link and length. My final deliverable was a literature bibliography explaining different concepts like each chosen pollutant and ailment and exposure range, and organization, a bulleted explanation and analysis of each source, and a final table of all of the data compiled.
While my contribution to the health assessment did not include research on specifically the Savannah area, it is important to look at general sources connecting pollutants and their effects on a population. And, just like the community profile report, the health assessment can be used by many different actors for many different purposes. Sometimes, the condensed version of a lot of complicated information can be even more helpful than hundreds of pages of equally important research, but in complicated and inaccessible verbiage.
Overall, my work with the Smart Sea Level Sensors Community Engagement team was enriching largely due to my team. My team helped me with any questions I had, and encouraged me to take a task and run with it. If I had a different idea about how to complete a project, or even ideas about their own projects, that kind of creativity was encouraged. And this is an idea that Georgia Tech proliferates in other research and general studies.
What is community engagement, and why is it important to SSLS?
Introduction
Typically, when most people hear about the Smart Sea Level Sensors (SSLS) project, they are dazzled by the innovative sensor technology and data visualization tools, as well as the incredible educational programs that support sensor implementation. But perhaps less well-known is the hard work that the team has invested in community engagement since the project’s inception. The purpose of this blog post is to clarify the role of the Community Engagement (CE) team in the SSLS project, and to share some of the projects that we have worked on over the past several years.
My name is Meaghan McSorley, and I’m a third year PhD student in the school of city and regional planning. I work with Dr. Nisha Botchwey at the intersection of public health and urban planning. My research focuses on the “people side” of sustainability, and the question of how we can plan for healthy, equitable, and thriving cities for all. I’ve also been a member of the SSLS Community Engagement (CE) team since last summer. I had the opportunity this summer to work with the City of Savannah through the Serve-Learn-Sustain internship program. As a part of this blog post, I’ll share a bit about what I worked on this summer specifically, as well.
What is Community Engagement?
Before we dive into all of the projects that our team has worked on, it’s important to understand what we mean by ‘community engagement.’ There are many definitions available, and also a fair amount of disagreement among different disciplines. There are also adjacent terms like outreach, inclusion, and participation that are often deployed in these conversations.
To our team, community engagement is primarily about building relationships, and includes any activities designed to engage members of the public around issues of climate change, sustainability, resilience, and environmental justice. Community engagement is important because it not only provides the team with better information as we develop solutions around climate change issues, but also because it provides opportunities for residents and other community members to begin developing their own ideas about how to address these issues.
Our team also defines ‘community’ quite broadly. Our project team includes members of the Savannah local government, and non-profit leaders, both of whom constitute forms of community. The SSLS project also engages students, teachers, and residents, who also constitute additional communities. Our team hopes to engage broader and broader publics in our work and to create more opportunities for resident engagement and collaborative leadership over time.
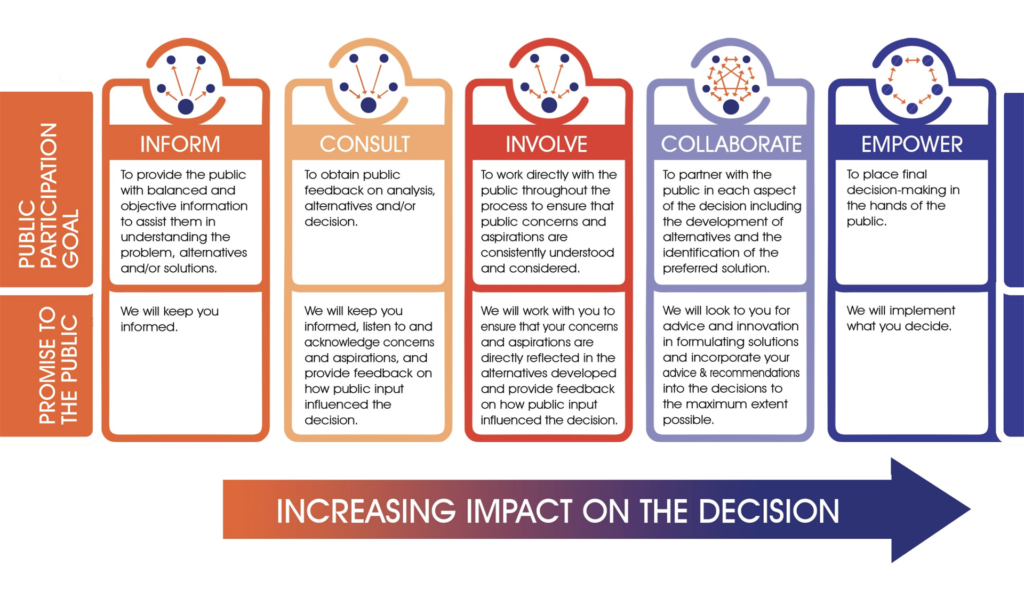
It is important to briefly ground those two definitions in some broader theory. There are many different forms, styles, and levels of community engagement. This means a diversity of approaches and activities to choose from. Perhaps the easiest and most important way to understand community engagement is that it is a spectrum, which moves from little public involvement to substantial public involvement. The following graphic comes from the International Association of Public Participation (IAP2), though it has intellectual heritage in the work of Sherry Arnstein (1969) and other scholars.
Moving towards greater empowerment is nearly always the goal because it grants more power to the public in directing decision-making. However, it takes time to build towards empowerment. Establishing trusting relationships, finding common language, and building the skills and knowledge of community members, as well as of project team member knowledge and skills about working with the community are all important steps towards empowerment that must be in place first. As such, it’s common for engagement activities to take place across the spectrum under a variety of different circumstances.
SSLS Community Engagement Team
There are many forms of community engagement present within the SSLS project. The project grew out of conversations between members of local government and Georgia Tech faculty, which itself shows how the very roots of this project grow out of collaboration with one form of community. The educational programming is another example of how the project has a sustained commitment to involving the broader public in the project.
The Community Engagement (CE) team includes students and faculty from Georgia Tech, staff from City of Savannah, and representatives of the Harambee House Citizens for Environmental Justice, a Savannah-based non-profit organization dedicated to activism and advocacy around issues of environmental justice.
Much of what our team has been doing so far has been about building relationships. The way that we do this is by listening deeply to learn about the various communities in Savannah and their needs and desires and developing research products that support both local government in engagement, which supports residents in community advocacy. This has included engaging with residents, non-profit organizations, as well as coordinating with other departments at the city.
Specifically, the CE team has conducted an in-person collaborative map-making workshop as a part of the Map Room; archival research; as well as quantitative social scientific investigation of publicly available data. We have developed surveys and other tools to support the City in engaging the public – for example, around a neighborhood emergency preparedness plan, which was also developed by this team. The team has also produced a community profile; the promise inventory; a brief air quality health assessment on two neighborhoods; and an engagement brief to support the City’s 100% Clean Energy plan development process. We have created opportunities for master’s, undergraduate and high school students. Members of the team have also participated in the installation of a gateway and temperature/humidity sensors, as well as assisted the Harambee House in deploying and calibrating PurpleAir sensors that provide a topic to encourage community science. The team has also developed several project proposals and participated in grant-writing efforts.
My work this summer has focused on the health assessments and the Clean Energy engagement brief. Last summer, the Harambee House had requested that some general information about the connections between various health conditions and pollutants be summarized, and that locally available data around these pollutants and health be aggregated into a report. My role was to turn their ask into a specific set of tasks that could be carried out by the undergraduate interns, to provide resources and feedback, to write a cover page which summarized the work and included additional health-related information to contextualize the report. I also edited the final versions of the reports, which pulled together the information from each of the undergraduate interns, as well as my cover page.
I also conducted a literature review to develop a brief engagement plan for Nick Deffley, for the City’s 100% Clean Energy planning process, occurring later this year. The engagement plan included a list of resources to enhance engagement broadly, but also with a specific focus on the populations of interest for this plan; as well as resources that were specific to engagement around clean energy and other sustainability initiatives. In addition, the engagement plan included a list of suggested activities and methods for engaging the focus group populations, which included small to medium size businesses, large firms, industry, frontline or vulnerable communities, and youth. I also reviewed the public-facing survey and developed some additional and alternative questions for Nick to choose from in the next phases of engagement.
Next Steps
Much of the team’s work so far has been focused on Hudson Hill, a low-income, historically Black community on Savannah’s west side that is surrounded by heavy industry. Hudson Hill residents do not typically struggle with flooding, which has sometimes made the CE team’s involvement with this neighborhood confusing. However, the reason that the CE team has done so much work with this community is that the Harambee House has a close relationship Hudson Hill residents and neighborhood leadership. Additionally, Hudson Hill has very active residents who have been advocating for environmental justice in their community since at least 2002, which means that they have been quick to engage on a variety of projects.
As the team began to look towards the future of the SSLS project and our engagement work, it became clear that identifying an additional community to work with was an important next step. We wanted to bring our work into closer alignment with the broader SSLS project by choosing a community that struggled with flooding. The Harambee House requested that we put together a health assessment for Ogeecheeton, and through collaboration with SSLS team members working on sensor placement optimization, we were able to identify a group of neighborhoods that included Ogeecheeton as our next focus area. This group of neighborhoods appeared as a great ‘next best’ location to place a sensor, and so it is our team’s hope that we can support having a sensor placed there. We would love to turn the sensor placement into an engagement and educational opportunity for the community and look forward to collaborating with the sensor team on this.
Rain Gauges, Dashboards, and Cellular-Capable Sensors: My Summer on the SSLS Team
I’m Mark Leggiero – one of two interns named ‘Mark’ working on the Sensor Development Team for the SMART Sea Level Sensors (SSLS) project. I am a senior at Georgia Tech with a dual major in Mechanical Engineering and Physics, and this is my first semester interning with Serve-Learn-Sustain, the Institute for People and Technology, or SMART Sea Level Sensors!
Starting Off – Adapting to my Project
I’ve made great strides in growing my technical skills throughout this summer internship. Most of my previous experiences in sensor networks came through working on robots and automated systems during internships, courses, and personal projects (which mostly just required knowledge of mechanical systems and design). However, my work with SSLS has been focused on software development, and therefore I’ve had to become more adept in this field. To this end, I’ve learned a great deal about software development and communication protocols.
Adding Rain-Gauges to Understand Rainfall
The SMART Sea Level Sensors project manages a wide network of water level, temperature, pressure, and air quality sensors. My work began as the project leadership identified measuring rainfall as a logical next step to improve their capabilities. Understanding rainfall, for one, can help disaster management in Chatham County better understand which areas are experiencing heavy storm events. Additionally, this can aid in climate research, where rainfall presents an important factor in properly modeling flood events. It is fair to say that most of this variation in sea level comes from the ocean’s tide, however this isn’t the entire picture. Rainfall, inlet river flow, and other factors also affect water level in the region, especially as one looks further away from the coast.
Our first step was a market analysis for commercially available rain gauges. Through comparing 25+ models of rain gauges, ranging in technologies, prices, accuracies, etc., we selected Hydrological USA’s TB4 gauges. Currently, the project uses custom electronics (developed by Georgia Tech researchers Scott Gilliland and Peter Presti in collaboration with the Institute for People and Technology) to send data from the water level sensors to the dashboard using an ESP32 (a commonly available microprocessor) and LoRaWAN chip (Long Range Wide Area Network – a low-power radio communication protocol). A significant percent of my work this summer was spent getting the existing hardware to function with the TB4 rain gauges. Our largest challenge was ensuring that the updated firmware functioned in a manner which required as little power as possible, since the sensor units are run on batteries.
Initially, we hoped the software we developed would allow us to use either a water level sensor or rain gauge, but given the simple operation of the TB4 (a tipping-bucket rain gauge), we were able to update the firmware of the LoRaWAN hardware to collect both rainfall and water level data concurrently and through one unit.
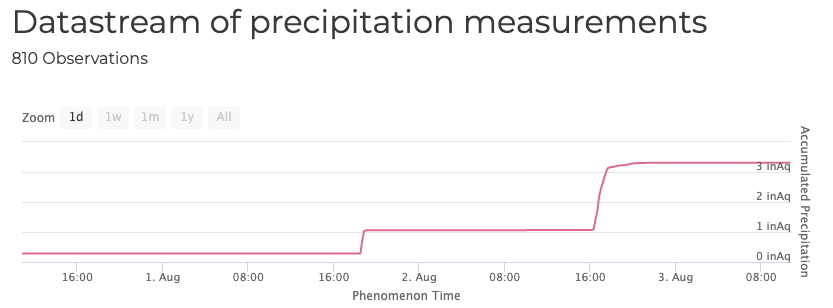
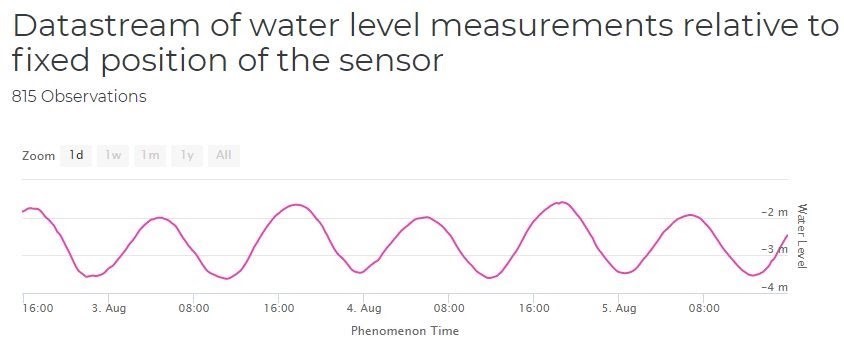
Since completing the first stable version of the new LoRaWAN firmware, we have deployed three units attached to rain gauges for testing (at the time of this post, each is labeled as a “Pre-Deployment Validation”). They are functional and uploading concurrent rainfall and water level data to our dashboard at their respective locations in Atlanta and Savannah:
Cellular-Capable Sensors
Transitioning from the rain gauges, the Sensor Development Team started work on implementing hardware which can send sensory data to the dashboard while only requiring a cell connection. This is mostly helpful in areas where radio communication (such as that used by the LoRaWAN board) is not very effective – including regions with a dense tree canopy. Scott and Peter have developed such a board, which is similar to the LoRaWAN unit, but requires different methods for developing its firmware. Namely, the heart of the board, the nRF9160 chip, can be programmed with custom software provided by Zephyr.
After successfully communicating with the nRF9160 chip, the team worked on understanding how the board would send data to the dashboard. We selected the MQTT (Message Queuing Telemetry Transport) communication protocol for sending sensor data, and use an open-source MQTT library, Mosquitto. We were able to accomplish sending pe-determined messages from the cellular board to a web-server we hosted on a low-cost Raspberry Pi 4B computer (used mainly for testing).
The next step for us is to write a program that allows the board to collect sensory data, starting with water level, and convert the data into a suitable message for MQTT. Given differences between LoraWAN and nRF9160 boards, setting up serial communication between the nRF9160 and ultrasonic sensor had been a challenge. Our final work on this board has been understanding the nRF9160 and Zephyr serial interface, and documenting our progress for whoever picks up this work in the future!
Concluding Thoughts
As mentioned near the beginning of this post, I learned a lot of valuable technical skills during these 12 weeks on this project. I am proud of what the Sensor Development team accomplished, especially since rain gauge units were able to be deployed. However, I want to appreciate the multidisciplinary aspects of the project (which were beyond my work). The SMART Sea Level Sensors project could have been counted as a ‘success’ if it stopped at environmental monitoring, however, through the vision of the project leadership (Dr. Kim Cobb, Dr. Russ Clark, Randall Matthews, Nick Deffley, and others), they have impacted the Chatham / Savannah area in numerous ways, emphasizing social justice. I have grown to admire, and hope to emulate, their forward-thinking in this area.
Lastly, I want to specifically thank Mark Putman, Dr. Russ Clark, Scott Gilliland, and Peter Presti for a meaningful internship experience!
Building a tool that helps track flooding
Hi, my name is Austin Ang!
I am a rising 3rd year majoring in Computer Science at Georgia Tech, but I was born and raised in Savannah, GA. I first learned about the Smart Sea Level Sensors team through the public school system here in Savannah. During my time at Jenkins High School, I worked on this project during the construction phase, helping build one of the initial waves of sensors. I’m really glad to be able to hop back in and work on it again during my time at Tech.
I’m building a tool that helps people track flooding.
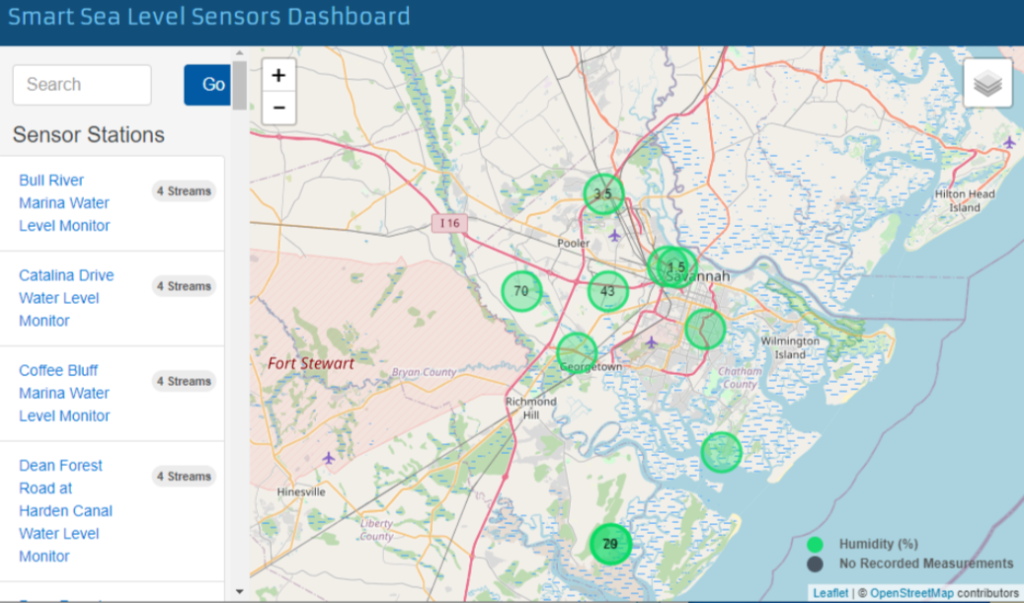
In high school,I constructed the actual pieces of sensors, assembling them with a team of classmates. Now, I’m working on the public facing dashboard: the dashboard is a publicly accessible website that anyone on the internet can use. It shows the sensors we have installed and the information that we learn from them. For the Smart Sea Level Sensor project, I’m using javascript to make the dashboard easy to use, part of my job is making sure that the data is present that the public would like to see most.
Starting out, it was pretty daunting…
Even though I’m a CS student, I needed to learn web development for this project. It was daunting to look at this well-established codebase and try to make sense of it. I spent a week or two seeing what each function did, and even when I thought I had it figured out, it would end up surprising me down the road! At first, it would take me days to make changes that I thought would be relatively simple, and that was frustrating, but I knew that with time most problems can be solved. Adding layers (like street maps and buildings) to the dashboards and updating the corresponding legends on this map was one of my first goals. Afterwards, I implemented a solution to find the last sea level measurement taken within a certain time period and have it appear on the map. This makes the data more accessible for users, so they don’t have to click on a sensor to see the water level measured there.
Why does it matter to me?
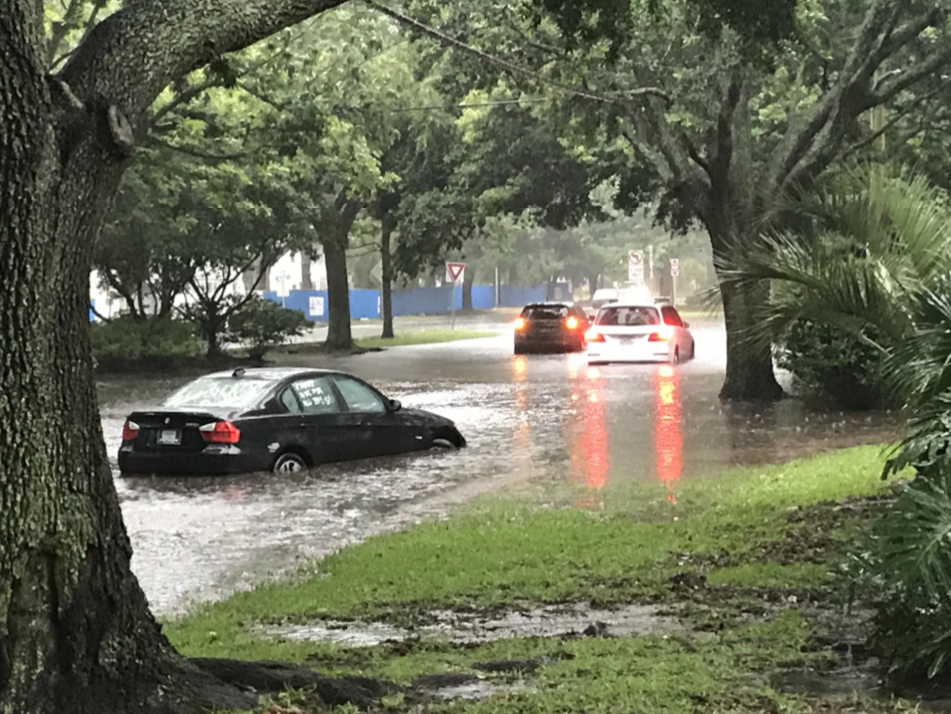
Climate Change. Those two words are so important, especially during the time that I am writing this. As a Savannah resident born and raised here I have seen the sea level rise issue and flooding as a major problem. I remember many times during hurricanes Matthew and Irma where we had to completely drop what we were doing in high school and evacuate the area. The idea of potentially losing our homes was terrifying and I wouldn’t wish that fate upon anyone else. This project matters to me because it could make a difference in a future hurricane / flood situation and mitigation of damage for my hometown is something I hope for.
What’s Next?
At the time of writing this, I just volunteered to help with the Georgia Tech IoT camp. It was really fun teaching kids about technology, showing them technologies extremely similar to what we use in the sea level sensors project, and helping to create the next!